Here’s how long stock market corrections last and how bad they can get
https://www.cnbc.com/2020/02/27/heres-how-long-stock-market-corrections-last-and-how-bad-they-can-get.html
Here’s how long stock market corrections last and how bad they can get
KEY POINTS
- There have been 26 market corrections (not including Thursday) since World War II with an average decline of 13.7%.
- Recoveries have taken four months on average.
- The most recent corrections occurred from September 2018 to December 2018. The S&P 500 bounced into and out of correction territory throughout the autumn of 2018.
- The S&P 500′s close below 3,047.53 — its current threshold for a correction — also marked the quickest 10% decline from an all-time high in the index’s history.
WATCH NOW
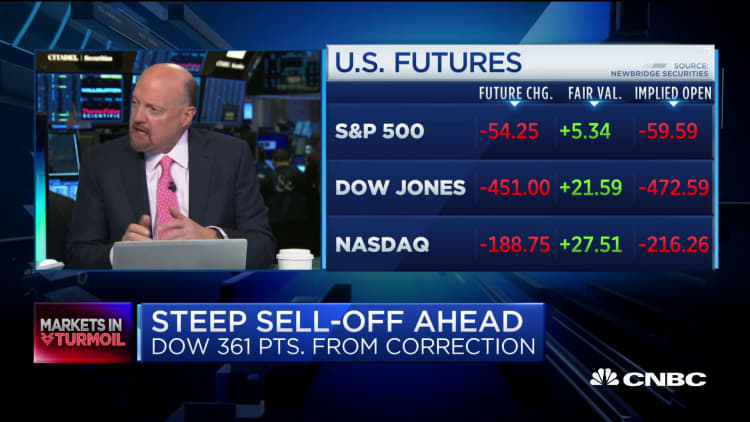
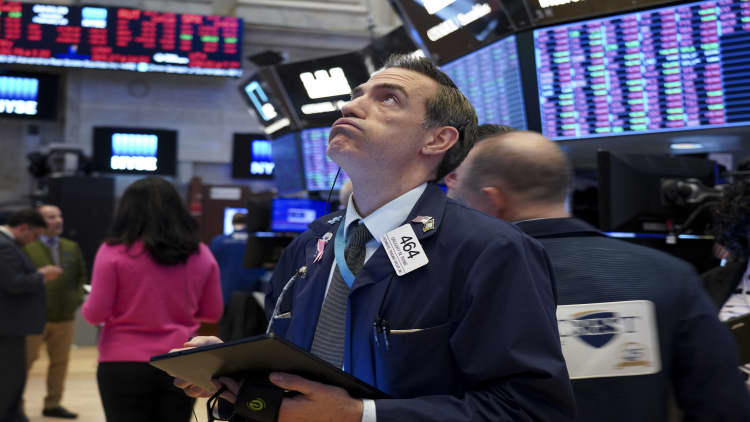
The U.S. stock market fell into a correction Thursday as investors punished equities in favor of safer assets as anxiety over the spread and potential impact of the virulent coronavirus.
A correction is defined as a 10% decline in one of the major U.S. stock indexes, typically the S&P 500 or Dow Jones Industrial Average, from a recent 52-week high close.
Historical analysis shows these corrections result in a 13% decline and take about four months to recover to prior levels, on average.
WATCH NOW
Here are the numbers, according to CNBC and Goldman Sachs analysis:
- There have been 26 market corrections (not including Thursday) since World War II with an average decline of 13.7% over an average of four months.
- Recoveries have taken four months on average.
- The most recent corrections occurred from September 2018 to December 2018. The S&P 500 bounced into and out of correction throughout the autumn of 2018 before plunging into a bear market (a 20% decline from its all-time high) on Christmas Eve.
The Dow and the S&P 500 each fell 4.4% on Thursday — the Dow lost a record 1,190.9 points — and each closed well in correction territory based on their recent record close. The S&P 500 and Dow are each down more than 10% since Monday and more than 12% each since their respective all-time intraday and closing highs hit earlier in February.
The S&P 500′s close below 3,047.53 — its current threshold for a correction — also marked the quickest 10% decline from an all-time high in the index’s history, according to Bespoke Investment Group.
- There have been 12 bear markets since World War II with an average decline of 32.5% as measured on a close-to-close basis.
- The most recent was October 2007 to March 2009, when the market dropped 57% and then took more than four years to recover. The S&P 500 closed in a bear market in December 2018 using intraday data.
- Bear markets have lasted 14.5 months on average and have taken two years to recover on average.
— CNBC’s Nate Rattner contributed reporting.


Comments
Post a Comment