Correction Might Be Over
Just some quick commentaries from me. I actually think there may “no second leg” to this correction. I’ve got some data and some charts that I track that shows that this rally is likely to resume.
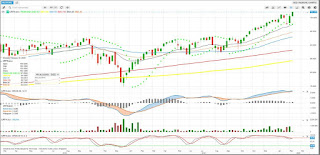
This is the MSCI World ETF. It is a weekly chart with an MACD overlay to track if the trend is up. You will notice the 150 week moving average is rising, the 20 week is > 40 weeks > 50 weeks moving averages.
Just some quick commentaries from me. I actually think there may “no second leg” to this correction. I’ve got some data and some charts that I track that shows that this rally is likely to resume.
On a separate note, I know these are general information. I will have a separate email and whatsapp for clients who have met the minimum AUM on actionable items. J
This is the MSCI World ETF. It is a weekly chart with an MACD overlay to track if the trend is up. You will notice the 150 week moving average is rising, the 20 week is > 40 weeks > 50 weeks moving averages.


Comments
Post a Comment