This is a sharing of my personal investment view and ideas, not financial advice. Everyone's financial objectives and risk tolerances are different. You are encouraged to do your own research and make your own decisions. Seek professional investment advice if need be.
Why The Third Year of the Presidential Cycle is Good For Stocks.
This is a good article. The first two years of the US presidential cycle is usually so-so as the new President tries to carry out his pre-election promises. This usually comes with painful reforms. Years 2 and 3 are usually when the President tries to pump prime the economy to get re-elected. I feel that the fourth year of the US Presidential cycle, which is also the election year of 2020, will not be good. Remember 2008? Then US president George Bush pumped the economy so much that it collapsed in 2008, and Obama had to rescue the country. 2012 coincided with the European Crisis and a stock correction. 2016 was a good year for the stock markets that just recovered from a correction in 2015.
2019 should be a good one for stocks. The correction we are seeing should be a mild one.
How Do Stocks Perform During the Presidential Election Cycle?
Let’s set aside for a moment the question of what political changes the upcoming election may portend, and consider a topic that may be of more interest to traders: How do elections affect the stock market?
Researchers have looked at this issue from a lot of different angles: Do equity markets prefer a Democratic or a Republican president? Is a victory by an incumbent or a challenger better? What about a divided versus a cohesive Congress?
Not all of this research has yielded actionable insights. Stock returns are the result of many different factors, so it’s not always possible to establish a direct link between developments in the stock market and the world of politics.
Nevertheless, we have been able to identify a few historical patterns in how markets have fared during different phases of the “election cycle,” or the four years leading up to each election. Of course, what happened in the past isn’t necessarily a guide to what will happen in the future, and the question of why such patterns exist remains a subject of debate. But traders may still find it interesting to take a closer look.
Breaking down the cycle
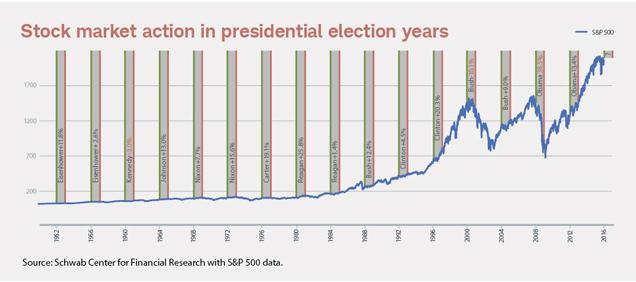
We looked at how the benchmark S&P 500® Index performed during presidential election cycles going back to 1950 and found the last year of the cycle—that is, the actual election year—has generally been good for equities.1 The S&P 500 rose 81% of the time and posted an average return of 6.6%.
It’s worth pointing out that these results include the most bearish election year in the data set, 2008, when the S&P 500 dropped 37%. That year coincided with the collapse of Lehman Brothers and saw some of the worst losses of the recent financial crisis.
The first year of the cycle, which coincides with the first year of the presidential term, has historically been the toughest environment for stocks. In the 16 cycles studied, only nine finished with the S&P 500 in the black. This 56% success rate is only marginally better than a coin flip, though the 6.5% average return in those years compares favorably with rates in other years of the cycle.
The third year of the cycle—the year before the actual election—was generally the best one for equities. They rose in the third year in all but two of the 17 cycles covered by our research, delivering average returns of 16.4%.
The chart below shows the S&P 500 at the start (green line) and finish (red line) of each presidential election year since 1950.
Financials, utilities thrive in election years
If we drill down into this data a little further, we can see that different sectors tend to do well at different points in the election cycle. Historical data comparing sector performance isn’t available as far back as the data for overall market performance, but we do have figures going back to 1992, giving us 23 years of information to analyze.
As you can see in the table below, the financial sector has been the top performer during election years, followed by utilities. Why the relative outperformance? Both of these sectors are highly regulated. Perhaps very little gets done politically during election years, meaning that there are likely to be fewer new regulations for these sectors than in other years. But again, politics and elections aren’t the only factors affecting sector returns.
Consumer staples, energy and health care have also done reasonably well in election years.
Looking ahead
Will this year look anything like election years past? It’s impossible to say. But traders may still want to keep these patterns in the back of their minds as they research and execute their strategies in the months ahead.
Below is the overall performance of my funds. For CPF, I put everything into funds. I refuse to buy SGD stocks because you should see the performance of MSCI Singapore below. In the last 1 year, the performance was down 5.9%. it is only this year that the performance went up slightly but it is still down. If I had used my CPF and cash to buy SGX listed companies I would have done at best 5% even with superior stock picking. Look at the other indices. MSCI world is up 16.1%, S&P500 is up 18.0%, China is up 38.6%, Europe up 6.2%, MSCI Asia ex Japan up 28.2%. NASDAQ was of course the best performer with 44.7%. So the growth is NOT in Singapore. It is either in the US or Asia, mainly China. Even the best companies from Singapore are listed in NASDAQ, e.g. SEA Ltd. We have become the “forgotten man” or “sick Man” of Asia in terms of stock markets. The average performance of my funds are 25.8%. this is unrealised return and doesn’t include realised gains...
The model portfolio is up 12.67% from 23 March to 22 July. This compares favourably against the Vanguard Global Stocks ETF (up 10.3%), but still behind S&P 500 ETF (up 13.89%) and well ahead of the HK Tracker Fund (-1.60%). XIRR is 44.67%. There were several lessons learned from this tracking. To be near the top performing ETF, in this case S&P500, you have to be constantly overweight US stocks, especially the big caps like Amazon, Alphabet, Facebook. To outperform you have to be extra careful with out of benchmark stocks, especially when they are extremely speculative, like Lemonade, ARK, ETFs, Square, Shanghai Airport. Once their trend dies, it is advisable to exit almost all your position since it will detract you from performance. The weighting is important. To outperform, you sometimes need to overweight the index stock with your strongest conviction, with a mix of momentum and growth. Do NOT worry too much about hedging the downside, especially if you are unl...
This is a good article to serve as a reminder. At the risk of sounding old, with 23 years of experience in the financial industry, and it may seem corny, but I must admit “I’ve seen it all before”. 1998 Asian Financial Crisis, 2001 Sep 11, SARS in 2003, 2008 global financial crisis. The chart does look scary. It is the fastest 18% fall in history because we are in the age of automation and robots trading. ETFs are also causing this sell down as it indiscriminately liquidates stocks when investors sell. Below is the S&P500 ETF, SPY. 18% drop from 18 Feb to now, in 15 trading days. If you are very worried, stretch out your chart on a weekly basis, and over 5 years. It now looks like familiar territory? It is now resting on the 150 weeks moving average. On 24 Dec 18, it rested on the same moving average and shot up by over 25%. On 8 Feb 2016, it tested again and recovered 53%. Now does it look familiar? We have seen this happen twice previously in t...


Comments
Post a Comment