Posts

Showing posts from March, 2020

Unprecedented Crisis Looming.

https://www.economist.com/graphic-detail/2020/03/14/control-of-the-coronavirus-gives-china-the-worlds-best-performing-stockmarket Looking at this website, I'm not comforted at all that China is the best performing stock market. It is scant consolation when the rest of the world falls by 70% and China falls by 50%! Here's the problem: this is unprecedented in modern history. There may be a series of lockdowns, not ONE lockdown. It may not end until either a vaccine or a cure is found. Vaccines and cures are at least 12 months away according to experts. https://www.youtube.com/watch?v=4kWXI8zMsGs&t=510s Watch Fallible above. As long as a few people are walking around with the virus, it will spread very quickly. In the 1930s, the Dow Jones Index collapsed 70%. That was during the Great Depression. This is likely to be a sharp Great Depression that lasts 12 to 18 months, until a cure is found. It is likely to be shorter but sharper than the Great Depression. The Lock ...
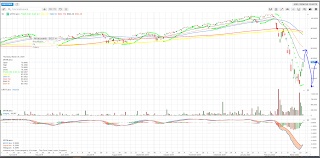
Market Update 27 Mar 2020. Twist and Shout

Image
https://www.cnbc.com/2020/03/26/paul-tudor-jones-says-stocks-could-retest-lows-as-virus-peaks-but-will-be-higher-in-3-to-5-months.html Above is an interview with Paul Tudor Jones. He said that it will be a "W" shaped recovery. What a month it has been. I started out 90% long equities, 10% precious metal on 1 Feb. I gradually turned to 40% long, 5% precious metals, 30% shorts, 25% cash by end Feb. But I listened to the advice of a "guru" who insisted that I should buy at the 150 days moving average. I was actually up 5% even as the stock markets started to fall after Valentines' Day. The investment nearly killed me. I managed to stop out all my long positions by 15 March. I went net short after 7 March and recovered some of my losses. Today, I have reduced my shorts to just 10%, long 30%, cash 60%. I believe that it will be a "W" or "U" shaped recovery. The economic impact of repeated lockdowns will be the most devastating since Worl...

Risk Management is a Large Part of Long Term Profitability

This is a personal sharing of what I am doing. You have to make your own decisions because different people have different needs, can tolerate different volatilities etc. The technical indicators turned bearish on 1 Mar 2020. It indicates a top to bottom drawdown of perhaps 20 - 35%. The S&P500 is already down 19%, 1% away from an "official bear". A 35% top to bottom trough will mean that the S&P500, from the peak of 3394 in Feb 2020, may fall another 21% to 2206. It will also mean that the Cyclically Adjusted PE ratio, which was 27x at the peak, will reach a far more reasonable 20x. There will be tremendous bargains to be made. The recovery at the end of a big fall will mean big returns. The most important thing in investing is not just to predict where the stock markets will go, but what to do if you are wrong with your views. I chose to "stop out" most of my equity positions in the first week of March, put on some inverse ETFs and put opt...

This Too Shall Pass

Image
This is a good article to serve as a reminder. At the risk of sounding old, with 23 years of experience in the financial industry, and it may seem corny, but I must admit “I’ve seen it all before”.  1998 Asian Financial Crisis, 2001 Sep 11, SARS in 2003, 2008 global financial crisis. The chart does look scary. It is the fastest 18% fall in history because we are in the age of automation and robots trading. ETFs are also causing this sell down as it indiscriminately liquidates stocks when investors sell. Below is the S&P500 ETF, SPY. 18% drop from 18 Feb to now, in 15 trading days. If you are very worried, stretch out your chart on a weekly basis, and over 5 years. It now looks like familiar territory? It is now resting on the 150 weeks moving average. On 24 Dec 18, it rested on the same moving average and shot up by over 25%.  On 8 Feb 2016, it tested again and recovered 53%. Now does it look familiar?  We have seen this happen twice previously in t...

Here’s how long stock market corrections last and how bad they can get

Image
https://www.cnbc.com/2020/02/27/heres-how-long-stock-market-corrections-last-and-how-bad-they-can-get.html Here’s how long stock market corrections last and how bad they can get PUBLISHED THU, FEB 27 2020 10:43 AM EST UPDATED THU, FEB 27 2020 4:24 PM EST Thomas Franck @TOMWFRANCK KEY POINTS There have been 26 market corrections (not including Thursday) since World War II with an average decline of 13.7%. Recoveries have taken four months on average. The most recent corrections occurred from September 2018 to December 2018. The S&P 500 bounced into and out of correction territory throughout the autumn of 2018. The S&P 500′s close below 3,047.53 — its current threshold for a correction — also marked the quickest 10% decline from an all-time high in the index’s history. WATCH NOW VIDEO 01:08 Cramer explains three traits investors should look for in stocks amid sell-off ...

A Great Sale is Here.

Image
First the fundamentals. I believe the Coronavirus has plunged the world into a recession for 1Q and 2Q 2020 GDP. But how long will it persist and what will be the impact on the earnings of stocks and their valuation? This video by  Aswath Damodaran  will give us some idea. Now he made this video five days ago as of this posting so he probably hasn't seen the 3 to 6% plunge on Thur and Fri.  https://www.youtube.com/watch?v=1vJdCpVxO7s&t=27s The impact on earnings is probably 5 to 10% for FY2020. Valuation of stocks probably by the same amount using DCF of 10 years with a discount rate of around 5.8%. We also know that stock markets are driven by liquidity. https://www.bloomberg.com/amp/news/articles/2020-03-01/no-place-to-hide-for-markets-looking-for-central-bank-salvation There is likely to be a significant rebound from here. 1) it's oversold, 2) liquidity find a home, 3) bond yields are zero so stocks are more attractive, 4) VIX is over bought. 5) there'...